
Use of Weighted Mean Income for Comparing Wealth by Zipcode in NYC (and comparisons with other publicly available metrics)
Sources:
- IRS 2015 NY Tax Info
- city-data.com - Tribeca
- city-data.com - Mott Haven
- point2homes.com - Tribeca
- point2homes.com - Mott Haven
This resource looks at the decision to use a weighted mean income for a group project at a data science bootcamp. The project was to optimize foot traffic and purchasing power in pinpointing subway entrance locations for the purpose of fundraising.
One task was to find zipcodes which yeilded the highest likelihiood of soliciting contact information from potential attendees at a fundraising event. For this purpose, we looked at IRS Tax returns for 2015. The income data was binned into icome brackets as follows:
- 0 - 25,000
- 25,000 - 50,000
- 50,000 - 75,000
- 75,000 - 100,000
- 100,000 - 200,000
- 200,000 and greater
looking at the dataset, we decided on a weighted mean income approach, instead of appropriating the the more commonly used median income; with the hope that it would yield a better approximation for wealth comparison. We chose midpoints of each bracket as the mean for the bracket, and then multiplied each midpoint by their counts (of submissions). The final step was to divide total weighted income by all counts for a zipcode.
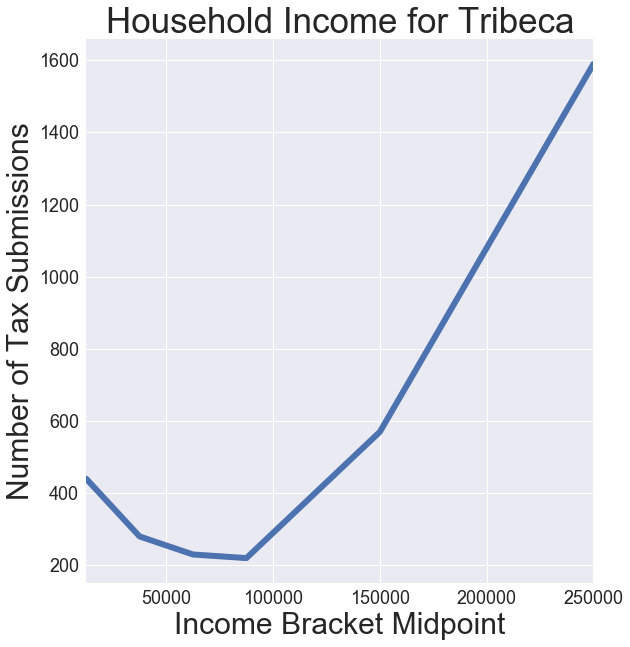
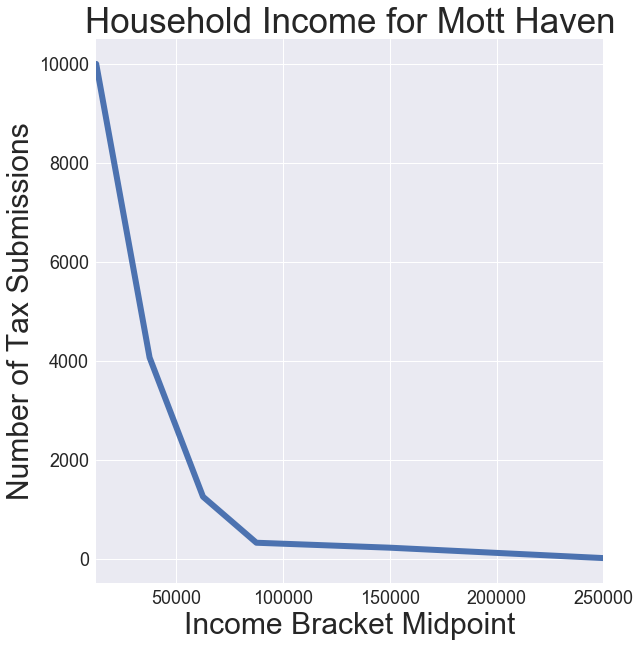
Having calculated weighted average income for each zipcode, we then graphed the results. We also looked at two disparate zipcodes in terms of spending power: Tribeca and Mott Haven. Our choice of metric seemed to tell a compelling story.
- Weighted mean household income for Tribeca: $159,947
- Weighted mean household income for Mott Haven: $28,093
Out of curiosity, I thought of comparing the data obtained with other parameters in different websites. city-data.com gives the following information for the zipcodes in question, albeit for 2016.
- Median household income for Tribeca: $196,692
- Median household income for Mott Haven: $25,495
I also searched point2homes.com for simimlar stats (once again, for 2016).
Tribeca:
- Average Household Income $203,018
- Median Household Income $118,959
Mott Haven:
- Average Household Income $31,092
- Median Household Income $21,661
The reason our results for Tribeca may be low is possibly because we capped the ‘200,000 and greater’ category at $ 250,000. This was to avoid extreme wealth influencing the data to the point of damaging the comparisons.
All in all, it seems that our choice of model is comparable with data available from other sources. Both average income and median income for both zopcodes show comparable results in the public domain.